
GIS, remote sensing and data analysis Maps and data analysis done by ecologists who know the ground.

A satellite map is only useful if someone understands what it shows. Our ecologists make the maps, run the analysis and check the results in the field, so you get answers you can act on, not only nice pictures.

  • Land cover maps and change over time from satellite data
  • Habitat and species distribution models
  • Statistics in R and Python, with clear, repeatable code

Rather talk now? Call +91 99704 38127 or WhatsApp.

Get a quote for GIS or data analysis

Free scoping call, then a fixed quote within 24 hours.

Prefer to talk? WhatsApp us. Your details are used only to reply to you.

Organisations that rely on our numbers

  • Bajaj Auto
  • Rustomjee
  • Praj Industries
  • Amar Builders
  • Empress Garden
  • Pune Knowledge Cluster
  • Jeevitnadi

Who calls us for maps and analysis

Companies

Site maps, green cover change and land use around your plants for ESG and planning.

Government bodies

Forest, green cover and land use maps, and monitoring of plantation and restoration projects.

NGOs & conservation groups

Habitat maps, species models and analysis of long-term monitoring data.

Researchers & universities

Spatial analysis, statistics and machine learning for ecological and environmental studies.

What we can do

  • Land use and land cover maps
  • Vegetation change over time (NDVI)
  • Habitat and species distribution models
  • Green cover and canopy maps
  • Biodiversity indices and statistics
  • Field checks of satellite results
  • Maps as KML, shapefile or web map
  • Clean data and code with every report

We mostly use free Sentinel-2 and Landsat satellite data, and higher-resolution images when a site needs them. Our team has published peer-reviewed work using these methods.

Get my quote
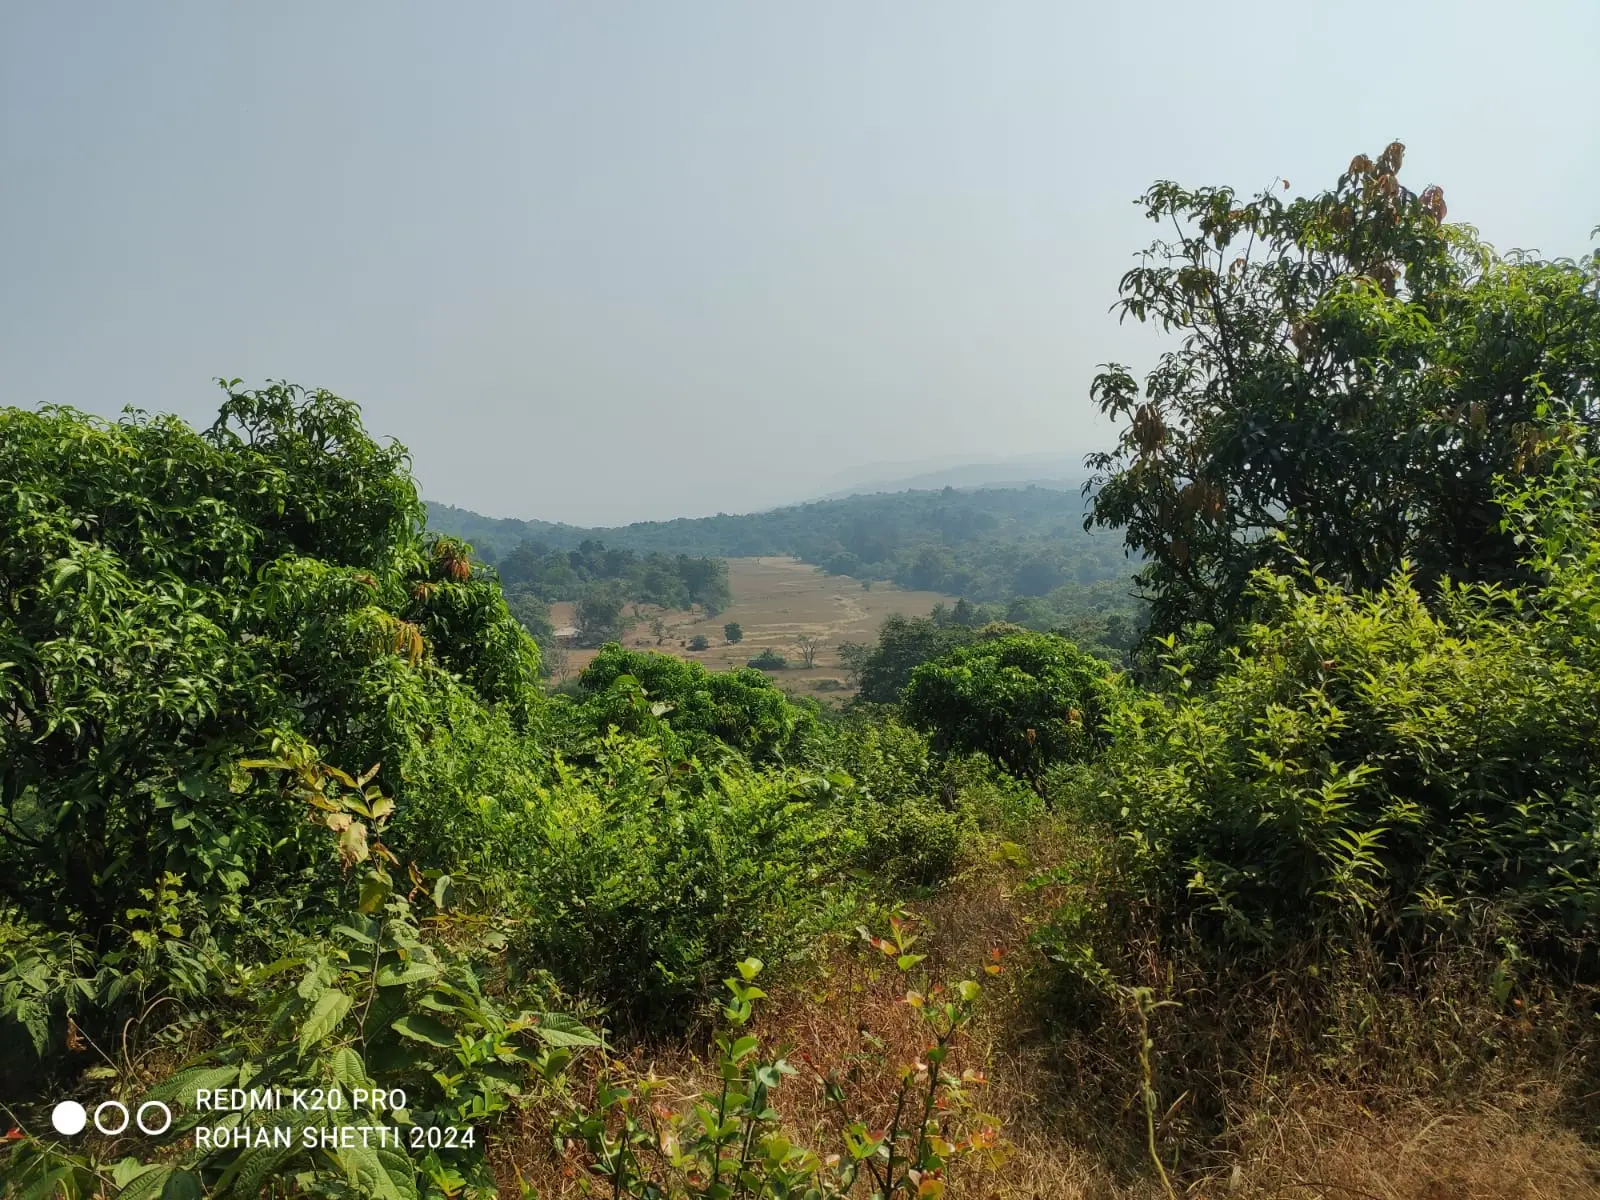
Mixed landscape of forest, farms and hills of the kind we map from satellite data

Projects where mapping and data were key

Field survey work at the Bajaj Auto campus

Bajaj Auto, 2026

Bajaj Auto Biodiversity Assessment

Biodiversity assessment, GPS-tagged tree inventory, and habitat mapping across the Bajaj Auto campus — capturing flora, microhabitats, and on-the-ground species records to support sustainability reporting and carbon estimates.

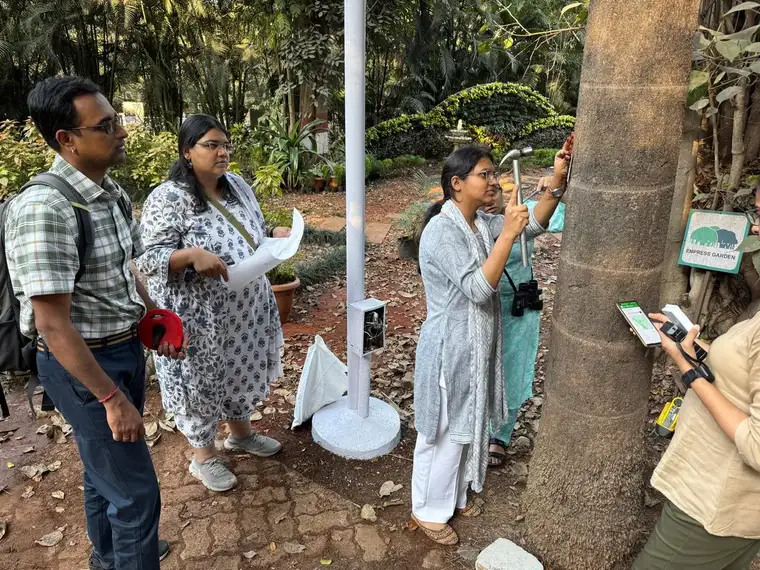
Field work at Empress Botanical Garden, Pune

Empress Botanical Garden (with RRBCEA), 2026

Empress Botanical Garden Ecological Study

Ecological survey, tree-by-tree census, and air-quality monitoring at Empress Botanical Garden, Pune, in collaboration with RRBCEA — making it Pune’s first park with publicly available carbon-assessed tree data.

Carbon and tree census fieldwork at Fergusson College

Fergusson College (Autonomous), 2026

Fergusson College Carbon Sequestration & Tree Census

Carbon sequestration study and full tree census across the Fergusson College (Autonomous) campus, quantifying the green cover’s ecological value.

See all projects

How it works

  1. 1

    Tell us the question

    What do you want to know, for which area and which years? Existing data helps but is not needed.

  2. 2

    Collect the data

    Satellite images, your records and, where needed, field surveys by our team.

  3. 3

    Analyse and check

    We run the maps and statistics, then check a sample of the results on the ground.

  4. 4

    Deliver

    Maps, tables and a short report in plain language, with the data and code.

Questions we get asked

What satellite data do you use?

Mostly Sentinel-2 (10 m resolution) and Landsat (30 m), which are free and go back many years. For small sites we use higher-resolution images when needed.

Why do you check results in the field?

Satellite maps can confuse things, for example a shaded plantation with natural forest. Checking a sample on the ground tells us how accurate the map is, and we report that.

Which tools do you use?

QGIS, Google Earth Engine, R and Python. You get the data and code along with the report, so the work can be repeated.

Can you analyse data we have already collected?

Yes. We often clean and analyse survey or monitoring data that organisations already have, and explain what it shows.

Do you teach these methods?

Yes. We run workshops on statistics, R, environmental analytics and machine learning in ecology. See our workshops page.

Get maps and analysis you can act on.

Tell us your question and area. We will suggest the simplest way to answer it.

Call WhatsApp Get quote